
How to forecast more accurately: lessons for the airlines from other industries
Although other industries may be less sophisticated in their overall approach to forecast accuracy, could the airlines may be missing a metric(k)? Tom Bacon shares insights
Unit revenue (RASM) is one of the most important metrics in the airline industry. And Revenue Management (RM) plays a critical role in achieving strong RASM performance. By accurately forecasting demand for each flight or seat, revenue management adjusts pricing to maximise unit revenue.
By predicting when demand is high and relatively inelastic, lower fares can be restricted; by anticipating when demand is low but elastic, lower fares can be made more available.
However, if you don’t measure it, it won’t come under the spotlight. This applies directly to demand forecast accuracy – still, somewhat surprisingly, airlines don’t always measure forecast accuracy in a disciplined way. Often it’s embedded in the RM system and when analyst intervention overrides the automated forecast, the old forecast is replaced, not saved. Also, some systems or procedures allow the analyst to adjust the allocations without directly adjusting the forecast – losing any ability to understand forecast trends. Here, perhaps, airlines should be looking outside their industry for benchmarking opportunities that can improve overall forecasts and revenue results.
Forecast benchmarking metrics used by other industries:
- Forecast Accuracy: This is the sum of the absolute values of the errors calculated as actual minus forecast. Although we would love 90% or 95% accuracy, in many cases, forecasting can still add value even with 70% accuracy and lower.
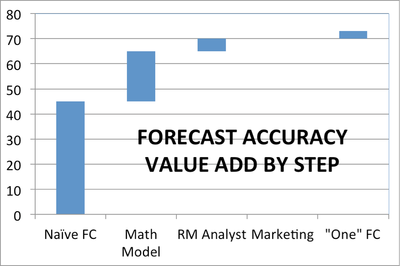
- Accuracy by step/person/dept in the process - Forecast Value Add. Often, there are many steps in a forecast:
1) A naïve forecast
2) A sophisticated algorithm
3) Human intervention including input from Marketing, Sales, Finance, Operations, and other departments.
How Heinz Corporation does it: This household name monitors more than ten distinct steps in the forecast process for its thousands of consumer products. How much does the algorithm improve the forecast vs. a naïve forecast (‘forecast value add’ or FVA)? Who touches the forecast? Does ‘one’ forecast result from some kind of collaboration? How does this collaboration improve accuracy?
- Trends in Accuracy: Are we getting better or worse at our 60-day out forecasts? Many companies report that absolute accuracy changes over time – in a highly dynamic market with large unforeseen changes - but that FVA for key steps in the process can be a more consistent measurement of performance.
- Accuracy by type of product: Some small origins & destinations may be ‘unforecastable’ where erratic results defy any pattern. Similarly, some small fare ‘buckets’ may exhibit erratic behavior. Both overall accuracy and FVA can be used to assess these – and potentially a low FVA will lead to less intervention.
- Accuracy based on the importance of the product to overall revenue/profit performance: Accuracy for a major segment is more critical than accuracy for the one flight to Des Moines. Like airlines, many companies are forecasting a million or more ‘stock keeping units’ on a regular basis. We all seek some way to categorise these and insure focus on the most important.
- Accuracy in non-absolute terms (bias): While forecast accuracy is the sum of the absolute values of the errors, forecast bias is the sum of the actual values of the errors. A non-biased forecast should result in an expected value of zero for the sum of the actual errors – there is the same probability of over-forecasting as under-forecasting. However, there are many reasons for ‘bias’. For example, analysts often overcompensate for factors not explicitly built into their forecast model. Cardinal health uses ‘bias’ reporting to keep analysts humble – after seeing consistent over-compensating, they tend to intervene less often and with less dramatic changes.
Some Airline Specific Forecast Metrics:
- Accuracy by time before flight: It’s critical for airlines that forecast accuracy is fairly good 60 days in advance – and that it continues to improve as the flight date gets closer. At one large carrier I worked with, we found accuracy unacceptable 60 days out and convergence was extremely slow. As a result, we had to radically change our forecast process. Also, of course, there are few actual bookings for high fare demand 60 days out – such high fare demand is normally much closer-in - so higher fare demand forecast accuracy must be measured much closer in.
- Forecast de-composition: Spill versus Spoilage. Are you missing the forecast because you have over-forecast demand – and therefore go out with empty seats (spoilage) or because you have under forecast demand and fill up too many seats with cheap fares (spill)? De-composing errors between ‘spill’ and ‘spoilage’ adds further value by actually quantifying the impact of over or under forecasting: did the 5% overage actually trigger bucket closings? If ‘spill’ was an issue, did we end up spilling lower fare passengers or higher fare passengers? Although this can be a complicated calculation, one carrier I worked with developed this metric for itself to measure forecast accuracy.
In summary then, despite the gains in airline revenue management over the past 30 years, forecast accuracy remains an under utilised metric. Other industries, many of which are much newer to demand forecasting and much less sophisticated in their overall approach than the airline industry, are far ahead of airlines in exploiting measures of forecast accuracy to continually improve their processes.
Tom Bacon, 25-year airline veteran and industry consultant in revenue optimization.
Questions? Contact Tom at tom.bacon@yahoo.com or visit his website http://makeairlineprofitssoar.wordpress.com/